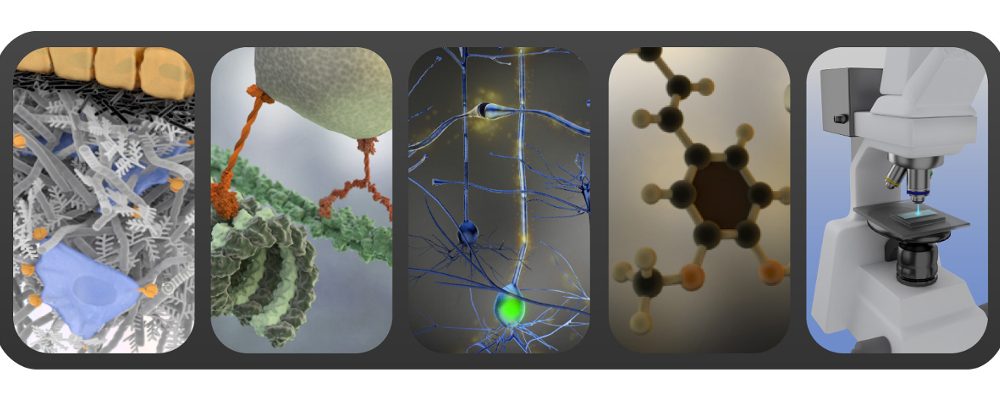
Publication of the monthly post on graphic design and scientific illustration and animation as tools for science and research. Compilation of different links and resources for scientists and researchers to help improve the way their scientific message is communicated through images.
Most of the posts listed below are available in one pdf document “Graphic design for scientists and researchers” – 2020 edition ready for download.
Latest post:
Augmented reality poster.
Previous posts:
Planning a scientific animation? Here is what to start with…
One file format to rule them all?
From Disney Studios into a scientific lab: storyboarding as a tool for research design.
The complicated world of colour models and what is important to know if you are a scientist.
Tips on illustrations of molecular representations that appear regularly in scientific publications and communications.
What is the role of scientific illustration?
Tips and tricks to design slides and adapt publication figures for scientific presentations
The why and how of working with a scientific illustrator
Graphical Abstract and Video Abstract – AudioSlides for scientific publications.
How to quickly transform an existing publication figure into an image for general public.
How to use colours effectively in scientific figures gives general tips on colour choices.
Scientific animation as a tool for researchers presents when and where you might want to use scientific animation instead of a static image.
Image formats and composition in scientific illustration. Golden ratio and rule of thirds.
Figures and images in scientific poster design presents in brief visual flow, notion of image directionality and usage of grids in scientific poster design.
Graphics software tips for scientists: a compilation of 3D and 2D graphics software tools worth (re-)discovering if you’re a researcher / scientist.
Vector vs raster graphics presents in brief differences and applications of vector and raster graphics and software tools.
Tips to improve scientific figures: a compilation of thrown together helpful links if as a researcher / scientist you want to improve the way you illustrate your publications and presentations with your figures, graphs, plots and your data visualization.
Interesting talks:
Vizbi.org website and notably:
The Art & Science of Cell Biology by G. Johnson
TED talks by J. Iwasa and D. Berry:
How animations can help scientists test a hypothesis
Animations of unseeable biology
TED talks from Hans Rosling in general and notably:
Let my dataset change your mindset
On data visualization in digital era:
Stop Drawing Dead Fish
