How to use colours effectively in scientific figures?
Often enough I see schematic representations in scientific papers or presentations that look something like this:

As many as seven colours are used, with same level of intensity (red, blue, yellow, orange, violet, green, magenta). The outcome looks… colourful. The downside is that this colourfulness does not help carry your scientific message. At this level of colour intensity and abundance, there is no hierarchy and no more distinction between elements. This image could be in black and white instead and the level of information would be exactly the same.
Here are some ideas how to use colour more effectively:
- choose maximally 2-3 colours per figure and vary their shades and saturation to increase the number of colour combinations;
- use complementary and / or neighbouring colours for colour harmony (colours opposite each other or neighbouring on the colour wheel). For example: orange and blue are a complementary pair, magenta and violet are a neighbouring pair;
- use warm colours (colours closer to red on the colour wheel) to push elements visually into the foreground. Analogously, cold colours will push them visually into the background so use them for elements that play a secondary role;
- create contrasts by introducing pale and intense shades of the same colour instead of only using different contrasting colours of similar intensity;
- be consistent in your colour code: if you have several figures in a presentation / publication highlight the same elements with the same colours in all of them (varying shades and intensity if necessary). This way the colour code helps your audience read the figures more efficiently;
- use spot colour: highlight in colour only the elements that really constitute the core of your message. Keep the rest of your image in grey scale. This is a very powerful way of using colours.
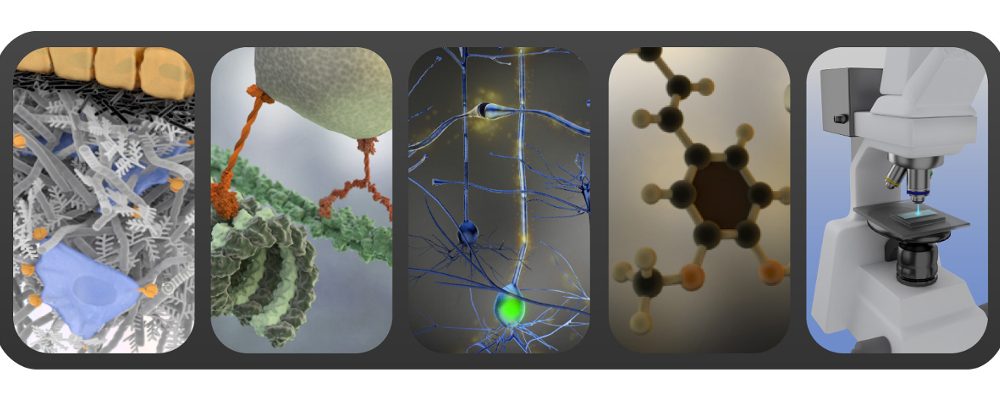
Same figure applying some of the guidelines mentioned above:


If you like the content of this blog, sign up to receive the latest posts on graphic design for scientists directly to your inbox!