From Disney Studios into a scientific lab: one idea that travelled far!
Does your team often work on the premise “first do the research, then just write down the results”? Does this lead sometimes to a stressful and inefficient process? Have you ever had a nice project idea late in the evening that then somehow slipped your mind and you can’t quite remember what it was anymore? If any of this sounds familiar, next time try to storyboard your projects! It can be immensely helpful to streamline, debug and flesh out initial ideas. But let’s do some edusplainement first…
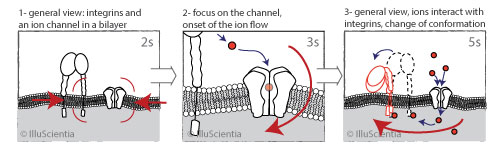
In its narrow definition, a storyboard is a visual outline in the form of illustrations, photos or images displayed in a linear sequence for the purpose of designing a motion picture or an animation, and was initially developed by Disney Animation Studios. This type of storyboard is useful if you plan to produce a short movie or animation for example, and is covered in the article on storyboarding for animations.
- by being written down and visually noted, storyboard can envision a research project and give it a more concrete and committed feel. It can also identify possible intermediate findings or results that can be interesting by themselves, thus, creating an added value to the set goal;
- it can be quickly reviewed and commented on by your team members providing an early feedback;
- it eliminates inconsistencies early on, includes uncomfortable questions and counter-arguments that otherwise might be left unnoticed or unanswered until the day you face a tough question from your audience (or a reviewer…);
- it streamlines your efforts as you never lose sight of your intended take-home message. If the time comes when you get bogged down by details it can always show you what you are aiming for, what has already been achieved and what is next to do;
- it can help with procrastination as it splits an often daunting overall goal into smaller, easier manageable tasks that can be tackled also on down days;
- it is in particular beneficial for larger or interdisciplinary teams where many collaborators need to produce a consistent story. A storyboard accessible to all should clearly show what their contribution is, where it fits in the story and when it should be done.
A great example of storyboarding in a scientific context is starting out a future publication draft or a grant application not by writing paragraph headlines but by outlining the content of figures and their legends. Once the main figure drafts are there and tell a consistent story, the accompanying text is fairly easy to write. The storyboarding of a scientific paper before actual writing is a great way to save on time and energy invested in every communication.
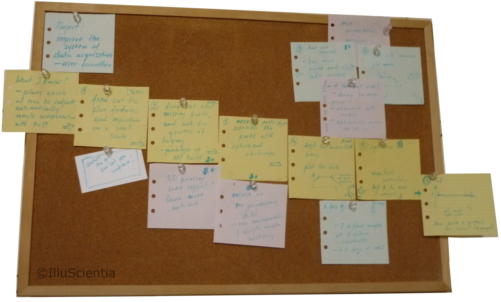
How to storyboard? It all depends on your personal preferences and habits but one traditional approach is to grab post-it notes (or similarly sized sheets of paper) and find a place where they can be attached (wall, board, window…), ideally for a prolonged period of time. Each post-it will contain only one idea, comment, task, image… Scribble your main goal and what your current ideas are. As you brainstorm, add smaller and bigger actions that can bring you to your goal, draw possible figures or mark what data plots will be necessary. Note down any ideas, questions and possible obstacles for each step. Try to arrange the post-its in a way so that you have a story timeline going from your current situation to what you want to achieve. Feel free to rearrange, add and remove elements. Once you have your main outline, invite colleagues to look at it with you and adjust your storyboard depending on their feedback. As your storyboard develops organically, keep track of changes by, for example, photographing it periodically and saving the images for later reviews if necessary.
If you prefer digital, slide-oriented software has everything you need. Each slide is one post-it containing one idea / comment / task / question / image. Once you have your initial storyboard, save it and don’t overwrite. Create a copy with a new date when you make your updates. The advantage is that a slide presentation can be easily shared with far away collaborators for feedback.
Whichever way you go and whatever your unique way of storyboarding is, the important part is to look at it periodically to see how you progress, update it and keep clear track of where you started out and what happened so far.
Sources and further reading:
Storyboarding for research: good article on the topic with a very detailed discussion of the tool especially in context of PhD thesis. This post is partially based on this article.
Storyboarding a presentation or a talk
Storyboarding in education
If you like the content of this blog, sign up to receive the latest posts on graphic design for scientists directly to your inbox!