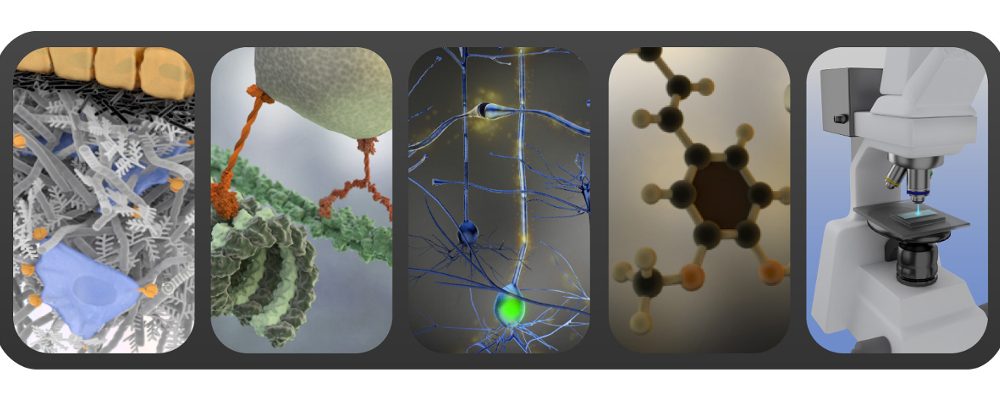
It is a 3D world !
Illustrations of molecular representations appear regularly in scientific publications and communications as they are used extensively in structural and functional studies. A wealth of effective graphics tools is available for rendering atomic structures in several standard representations (a list of software particularly adapted to biomolecular images is available at rcbs website).
Here is a handful of compiled tips extracted from my own experience and sources listed below:
- make it a habit to generate many figures for different contexts in one go: a figure for publications with high quality rendering and resolution (300 ppi) and a figure with a transparent background (png format) at 72 or 96 ppi for presentations. If it is a complex structure and you are likely to need different aspects highlighted, anticipate and prepare the different images in advance. If you think a gif of the rotating structure would be useful, generate the gif file as well. Much of this image generation can be automated in short scripts but it depends on your software of preference. This saves time of searching for the right file every time you need to generate a different version;
- show only the level of detail required to convey the specific scientific message in the given context: trying to highlight at the same time ligands, hydrogen bonding and the solvent accessible surface will most probably produce a confusing image. So, for example, highlight ligands if you write about them in particular but save the solvent accessible surface for another image;
- if your communication shows several images of 3D molecular structures, define a reference orientation early on, and indicate it in subsequent views to show how the following images relate to it. Similarly, introduce clear symbolic conventions and adhere to them throughout your entire communication;
- take time to write good figure captions: a molecular image (as almost any scientific illustration) needs a good figure caption that provides the necessary description. Be concise and informative. Even the most beautiful image is a missed opportunity if it lacks an equally high-quality caption;
- tools are tools: they have been developed with a specific purpose in mind and often enough excel in some tasks but not in all. So explore and experiment with different tools rather than stick always with a familiar one. The initial effort invested in learning a feature-rich package will repay soon enough. Instead of trying to twist a tool not meant to produce the result you want, just turn to a different tool that can do it in a wink of an eye;
- use anti-aliasing: if ribbons, tubes or stick representations are rendered on a white background, particularly in a cartoon style (edges darkened) the edges often appear to be quite jagged. This is referred to as aliasing and occurs because a pixel is finite and defined to belong entirely to the structure or the background, even if the centre of the pixel falls directly on the boundary line. To create images suitable for publication, most programs have anti-aliasing options that you should use in order to smooth out the jagged edges. Anti-aliasing is computing intense and makes most sense for single images, less so for animations;
- journal covers feature often molecular images based on structural data. Covers are nonetheless tricky to create as a certain degree of artistic licence and an extensive amount of post-processing of raw graphics are usually required. If your idea is just a high quality image of your structure, use a software tool that allows for high resolution rendering (2480 x 3508 pixels for an A4 image at 300 ppi). Try GPU-accelerated or graphic card rendering to speed up the process. Truly stunning results can be obtained by exporting your 3D structure into a professional 3D animation software. If you happen to know how to use a 3D animation software, save your structure as .stl or .vrml / .wrl mesh in your molecular visualisation tool. Most 3D softwares like Maya or Blender can import .stl or .vrml or work with dedicated plugins like ePMV that import your structure for you;
- move it: simple movies of molecules where the molecule is static and the camera is rotating are easily made in most of visualization softwares. In general, between 40 to 72 frames per 360° rotation are necessary. The movie should end with the same frame as it starts to have a smooth transition when it is played in a loop. Movies of dynamic molecules showing, for example, conformational changes can be generated with Bioblender (not all representation) or in other 3D animation softwares. The latter have however a steep learning curve;
- make it real: your 3D structures can be 3D printed – showing the 3D print of the molecule your structural studies focus on, is a great way to engage with your audience during a poster session or a presentation. I guarantee that the response will be more than positive. Ask your local 3D workshop for further help or watch here a tutorial on Blender work flow to prepare a 3D model for printing.
Further reading and sources:
An introduction to biomolecular graphics: very good article discussing in depth biomolecular images. This post is largely based on this work.
Visual Methods from Atoms to Cells: great review by the amazing artist and scientific illustrator David Goodsell.
ProteinShader: illustrative rendering of macromolecules: ProteinShader program, a new tool for macromolecular visualization, produces illustrative renderings of proteins that approximate what an artist might create by hand using pen and ink. The article is listed here as it contains some general tips as well.
Proteopedia – a scientific ‘wiki’ bridging the rift between three-dimensional structure and function of biomacromolecules: publication that introduces an interactive, wikipedia style resource attempting to link 3D molecular structures directly with their biological functions.
If you like the content of this blog, sign up to receive the latest posts on graphic design for scientists directly to your inbox!
